How to Calculate ROAS (and When It’s Different From ROI)

If you’re spending money on ads without tracking your return, you’re flying blind. Contractors who skip this step often keep pouring money into channels that quietly lose them money, or they cut channels that are actually working because they measured the wrong number.
ROAS and ROI get thrown around like they mean the same thing. They don’t. One tells you how a specific ad channel performed. The other tells you whether your entire marketing investment paid off. Confuse the two and you’ll make decisions based on incomplete information.
This guide breaks down both formulas, the variables that actually move your numbers, and which metric to trust depending on the decision in front of you. If you’d rather skip the math and plug in your own numbers right now, grab our free ROAS Calculator and get your answer in minutes.
The Short Version
- ROAS equals revenue divided by ad spend. ROI equals net profit divided by total investment, which includes labor, tools, and overhead, not just ad spend.
- A 5:1 ROAS (500%) is a commonly cited healthy benchmark, but what counts as “good” depends entirely on your margins. A $10,000 roofing job with $6,000 in materials and labor needs a very different ROAS than a service with thin overhead.
- Six variables move your ROAS: ad spend, management fees, cost per click, landing page conversion rate, average sale price, and lead-to-customer close rate.
- Use ROAS to compare channels and campaigns against each other. Use ROI when you need to know if the whole marketing investment, people and tools included, is actually paying off.
- ROAS can look great on paper while ROI stays underwater if your overhead is high. That gap is usually where a marketing spend “isn’t working” even though the ads technically perform.
What Is ROAS?
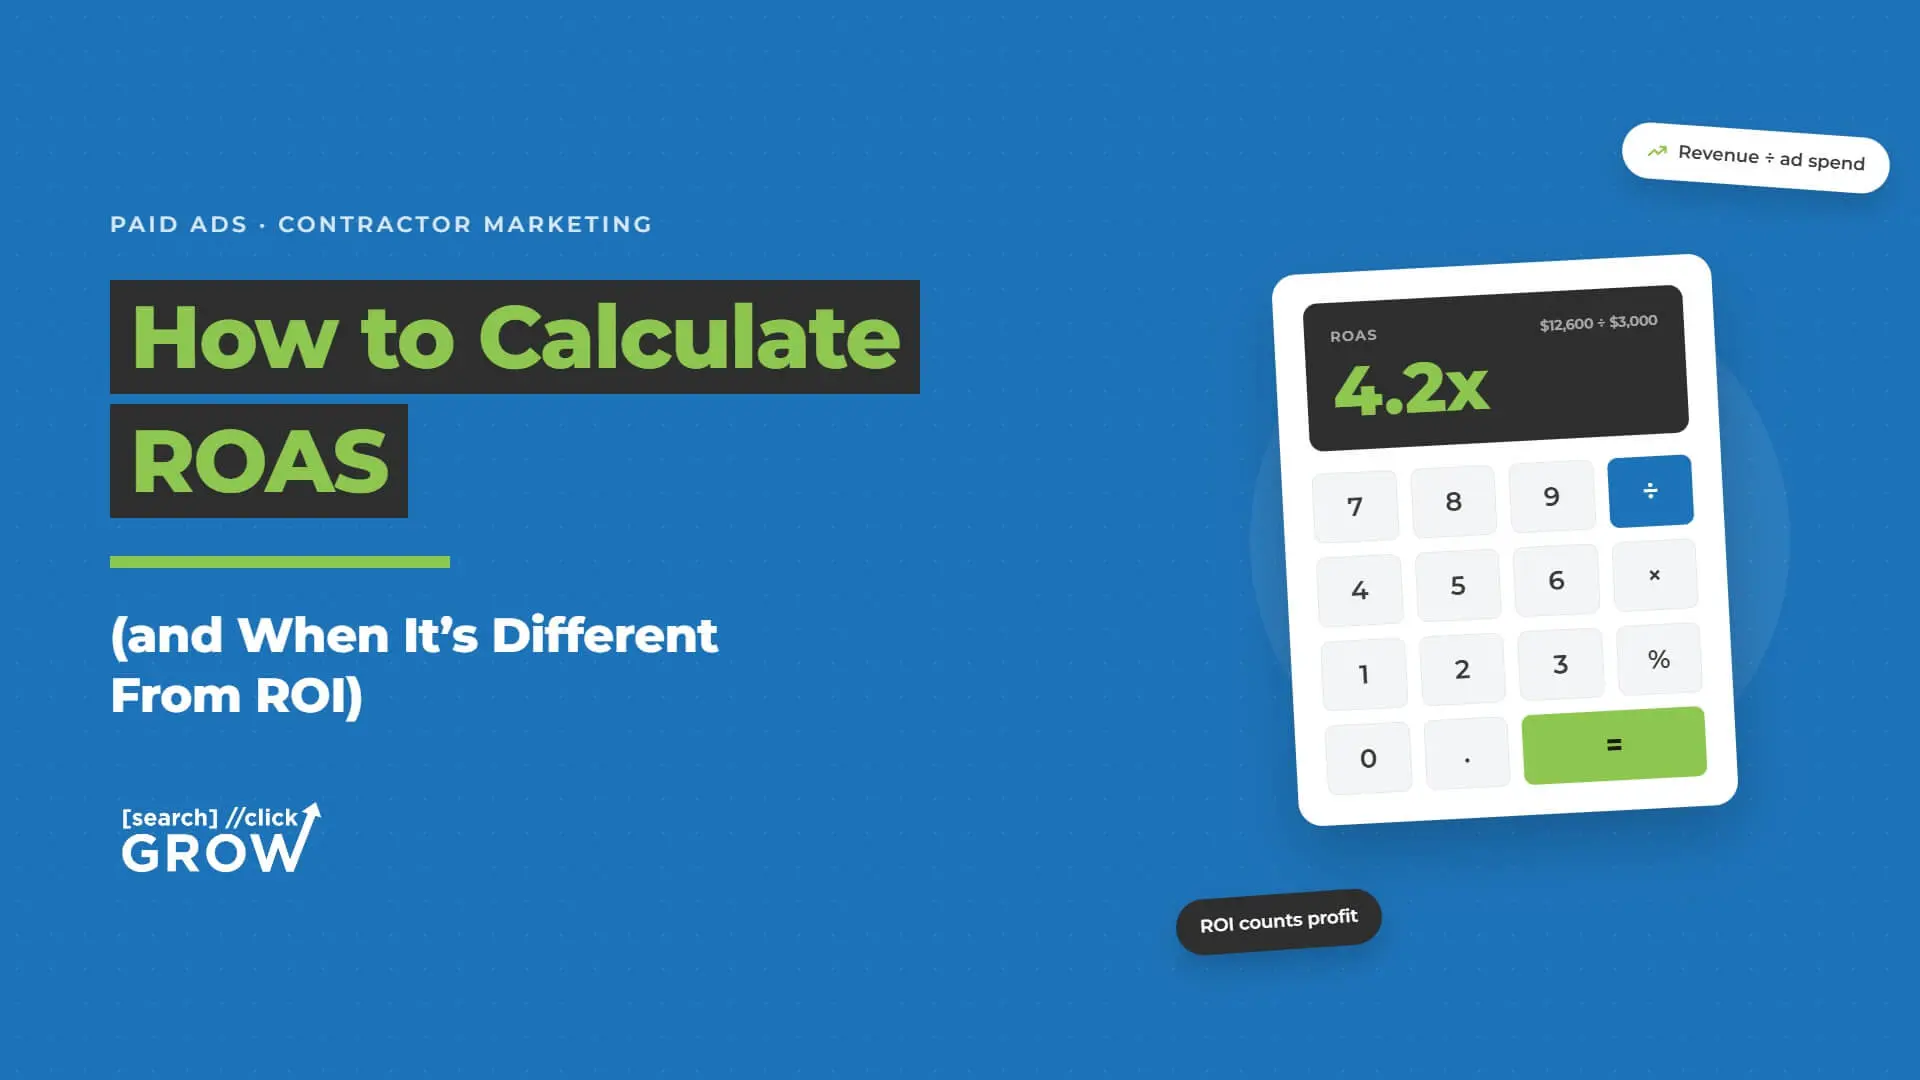
ROAS stands for return on ad spend. It’s the total revenue an ad campaign generates divided by what you spent to run it, shown as a ratio or a percentage.
Here’s a clean example. You spend $2,000 on a campaign and it brings in $8,000. That’s a 4x return, or 400% ROAS.
ROAS stays scoped to a single channel or campaign. It doesn’t account for what it cost you to build the ad, design the landing page, or pay someone to close the leads that came in. A business can post a strong ROAS on paper and still lose money overall once those surrounding costs get added up. That’s where ROI comes in.
ROAS vs. ROI: What’s the Difference?
ROAS measures the return on a specific ad channel. ROI measures the return on your total investment behind that channel, including creative, tools, landing pages, and the payroll hours your team spends closing the leads it generates.
The ROI formula looks like this: net profit divided by net spend, times 100 for a percentage.
Here’s where the two numbers actually diverge. Say you run a $3,000 Facebook campaign that generates $12,000 in revenue. That’s a 4x ROAS, a strong number by any measure. But now add in the real costs behind that campaign: $1,200 for a designer to build the creative, $800 in software subscriptions for tracking and automation, and roughly $2,000 in payroll hours for your salesperson to close the resulting leads. Your total investment isn’t $3,000, it’s closer to $7,000. Run the ROI formula on that and your net profit drops to $5,000 against a $7,000 investment, a return closer to 71%, not the 400% the ROAS number suggested.
Neither number is wrong. The ROAS accurately reflects how the ad channel itself performed. The ROI accurately reflects what the campaign actually cost you to run and close. A business tracking only the first number would celebrate a campaign that’s barely profitable once everything else gets counted.
How to Calculate ROAS
If you’d rather not run these numbers by hand every time you plan a campaign, our free ROAS Calculator does the math for you automatically. Otherwise, here’s how both formulas work.
The Simple Formula
Take total revenue and divide it by total ad spend, then multiply by 100 to get a percentage.
Example: you spend $2,000 on ads and generate $8,000 in revenue. That’s a 4x return, or 400% ROAS.
This version works for a fast gut-check, but it won’t tell you where in your funnel the return is actually coming from.
The Complete Formula (Ad Spend to Closed Deals)
The full version walks through every stage between spend and revenue:
- Ad spend multiplied by cost per click gives you total clicks
- Clicks multiplied by landing page conversion rate gives you total leads
- Ad spend plus fees, divided by leads, gives you cost per lead
- Leads multiplied by close rate gives you closed deals
- Closed deals multiplied by average sale price gives you total revenue
Here’s a worked example. You spend $2,000 with a $5 CPC, generating 400 clicks. A 10% landing page conversion rate turns that into 40 leads. Add $500 in management fees to your $2,000 spend and divide by 40 leads, and your cost per lead comes to $62.50. A 10% close rate produces 4 closed deals. At a $5,000 average sale price, that’s $20,000 in revenue, roughly a 700% ROAS after fees.
This version matters more than the simple one because it shows exactly which stage of the funnel is dragging your number down, instead of just handing you a final ratio with no diagnostic value.
What Affects Your ROAS
Six variables determine where your ROAS lands, and each one moves the number differently.
- Ad spend — raising or lowering your budget alone won’t change your ROAS percentage. It only changes your total revenue.
- Management fees — whether you pay an individual or an agency, these costs need to be part of the calculation. Skip them and your reported ROAS looks better than what you actually net.
- Cost per click — lowering your CPC raises ROAS only if traffic quality holds. Cheaper clicks that bring in poor-fit leads can hurt your conversion rate enough to erase the gain.
- Landing page conversion rate — one of the most overlooked levers. Doubling a 5% conversion rate to 10% doubles your entire campaign’s return without spending an extra ad dollar.
- Average sale price — moving this up or down changes total revenue and your return, but it has no bearing on any other variable in the formula.
- Lead-to-customer close rate — strong ad performance gets wasted if your sales process can’t close the leads it generates.
To see why these variables matter more than the top-line number, compare two campaigns with the identical 400% ROAS from the earlier example. Campaign A spends $2,000 with a $5 CPC and a 5% landing page conversion rate, producing 20 leads. Campaign B spends the same $2,000 with a $10 CPC but a 10% conversion rate, producing 10 leads at double the cost per click. If both close at the same rate and land the same average sale price, Campaign A generates twice the leads and, likely, twice the closed jobs, even though both campaigns report an identical ROAS.
The number alone hides this. Tracking these variables separately, rather than just watching one final ratio, is what shows you where the actual difference lives.
What’s a Good ROAS?
There’s no universal number here. Your margins determine what ROAS is actually sustainable, not a fixed industry target pulled from somewhere else.
Take a $10,000 job with $6,000 in materials, labor, and commissions. That leaves 40% margin, and that ceiling determines what ROAS makes sense for that specific trade. A contractor running thinner margins needs a much higher ROAS just to stay profitable, while a business with lighter overhead can operate comfortably at a lower number.
Lifetime customer value changes the picture too. Picture a business offering a low-cost intro special, something like a $100 first-visit package designed to get a new customer in the door. Run that $100 sale through the standard ROAS formula against typical ad costs and you’ll often land on a negative return. On paper, that campaign looks like a loser.
But most businesses running intro offers aren’t measuring a single visit. They’re measuring what that customer is worth over a year, or over the life of the relationship. If that same customer books three more services averaging $400 each over the next twelve months, the real return on that original $100 acquisition looks completely different. The first-sale ROAS and the lifetime-value ROAS can tell two opposite stories from the same campaign.
Now compare that to a high-ticket trade, like a full roof replacement averaging $15,000 with 35% margin. There’s no intro offer here, no repeat visit within the year. The entire return needs to justify itself within that single transaction, which means the acceptable ROAS threshold looks completely different than it does for the recurring-service business above.
The common reference point across most trades is a 5:1 ROAS, or 500%. Treat that as a starting benchmark, not a guarantee of profitability once your real costs and your specific margin structure get factored in.
When to Use ROAS vs. ROI
ROAS works best for comparing specific channels or campaigns against each other. Which platform performs. Which ad set converts. Which audience actually generates revenue.
ROI works best for evaluating your entire marketing investment, including creative production, software, and your team’s time. It answers the bigger question: is this worth doing at all?
Here’s where relying on ROAS alone can mislead you. Say you’re comparing two channels. Google Ads posts a 350% ROAS. Facebook posts a 500% ROAS. On the surface, Facebook wins easily. But the Facebook campaign needed a designer to produce new creative every two weeks, plus extra sales hours because Facebook leads tend to need more nurturing before they book. Once those additional costs get factored into an ROI calculation, the picture can flip entirely, with Google Ads delivering the stronger actual return despite the lower ROAS.
Tracking your ad ROI down to the zip code level is one way contractors catch a version of this same gap before it drains a budget, since two zip codes can show identical ad costs while producing wildly different real revenue once close rates and job sizes get factored in.
Track both metrics side by side rather than picking one and ignoring the other. Each one catches something the other misses.
Common Questions About ROAS
What counts as “ad spend” when calculating ROAS?
For an accurate number, include management fees along with the media buy. Media-buy-only ROAS looks better than it actually is.
Why can a campaign have a great ROAS but still not feel profitable?
Overhead costs sitting outside the ad platform are usually the reason. That’s the ROI gap covered earlier in this guide.
How soon can I trust my ROAS after launching a new campaign?
Give it enough volume first. A handful of clicks or leads isn’t a reliable sample, so wait until the data accumulates before drawing conclusions.
Does a low ROAS always mean I should shut down a campaign?
Not necessarily. Check your landing page conversion rate and close rate first. The ad itself might be doing its job while a downstream step is the actual problem.
Is there a different “good ROAS” for high-ticket jobs versus low-ticket, high-frequency ones?
Yes. It ties back to margin and lifetime value. A single expensive job and a stream of smaller repeat jobs can both hit a healthy ROAS through very different paths, as the intro-offer and roofing examples above show.
Know Which Number You’re Actually Looking At
ROAS and ROI aren’t competing metrics. They answer different questions, and tracking only one leaves a blind spot in your numbers.
A business watching ROAS alone can look successful while quietly losing money once you count the real costs. That gap is exactly what trips up contractors who assume a strong ad platform number means a healthy business.
Start by running your own numbers through our free ROAS Calculator. If the results raise more questions than they answer, book a strategy call with our team. We do this with contractors every day.